CIS Price Analysis
BTC / US Dollar Analysis (BTC/USD)
08/06/2021 18:00 UTC
|
Price / Performance Summary |
|
|
|
|
|
Price |
32.973 |
|
High |
36.833 |
|
Low |
32.586 |
|
|
|
|
7 Day |
-11,6% |
|
30 Day |
-43,9% |
|
3 Month |
-39,9% |
|
6 Month |
80,6% |
|
9 Month |
180,9% |
|
12 Month |
237,4% |
|
Simple Moving Averages (d) |
||
|
|
Value |
Action |
|
10-d |
36.056 |
SELL |
|
20-d |
36.817 |
SELL |
|
30-d |
40.526 |
WEAK SELL |
|
50-d |
46.329 |
WEAK SELL |
|
(6,21)-d |
35485 - 36912 |
WEAK BUY |
|
(50,200)-d |
46424 - 42048 |
HOLD |
|
Exponential Moving Averages |
|
|
|
10-d |
35.770 |
SELL |
|
20-d |
38.148 |
SELL |
|
30-d |
40.431 |
WEAK SELL |
|
50-d |
43.856 |
WEAK SELL |
|
Simple - Exponential Moving Averages Pairing |
||
|
15-d |
36626 - 36531 |
SELL |
|
Oscillators (d) |
||
|
|
Value |
Action |
|
RSI (14) |
32,83 |
WEAK BUY |
|
MACD (12,26) |
(-3308 -3608) |
WEAK SELL |
|
CCI(14) |
-182 |
BUY |
|
Bollinger Bands |
N/A |
BUY |
|
Chande Momentum Oscillator |
-32,34 |
HOLD |
|
DEMA(20,50) |
33.582 & 37.958 |
WEAK SELL |
|
Stokastik Oscillator (14,3,3) |
11,32 & 18,04 |
WEAK BUY |
|
Williams %R |
-88,68 |
BUY |
|
Chaikin Osilatörü |
-1,75k |
WEAK SELL |
|
Detrended Price Osilatörü |
-11765 |
HOLD |
|
Volume-Demand Oscillators (d) |
|
|
|
Demand Index |
-0,26 |
WEAK SELL |
|
Money Flow Index |
39,69 |
HOLD |
I. Trend Analysis
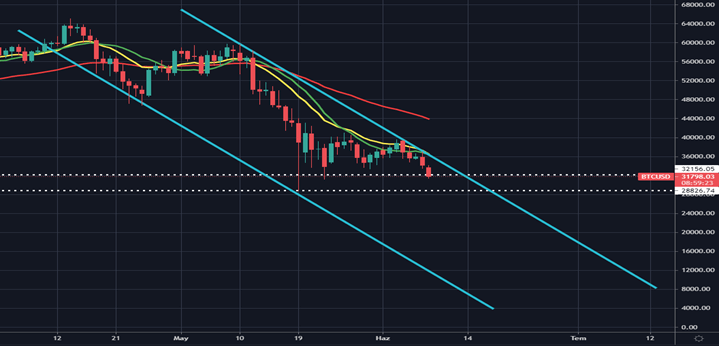
Chart 1 – Trend Analysis
We are in a sharp downward trend that started in April 2021 and continues until today. The trend continues between 2 parallel trend lines, the trend analysis suggests that this trend will continue unless it is broken upwards.
II. Support & Resistance Points & Fibonacci Retreament
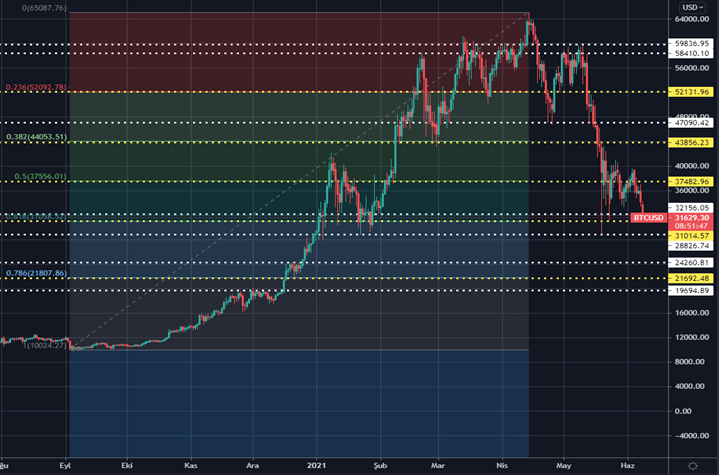
Chart 2- Support and Resistance Points & Fibonacci Retreatment
Here are the 5 main support and resistance points.
|
MAIN RESISTANCES |
|
|
MAIN SUPPORTS |
|
|
|
|
|
|
|
|
5.Main Resistance |
$58.410,000 |
|
1.Fib Support |
$31.014,000 |
|
4.Fib Resistance |
$52.131,000 |
|
2.Psycological Support |
$30.000,000 |
|
3.Main Resistance |
$47.090,000 |
|
3.Main Support |
$28.826,000 |
|
2.Fib Resistance |
$43.856,000 |
|
4.Main Support |
$24.260,000 |
|
1.Fib Resistance |
$37.482,000 |
|
5.Fib Support |
$21.692,000 |
III. Formation Analysis
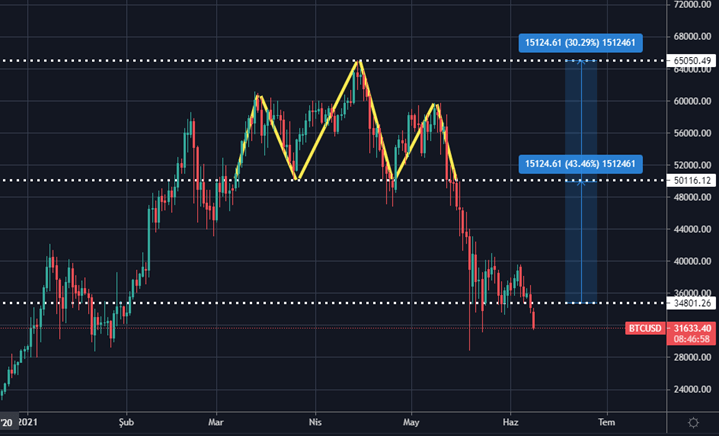
Chart 3-Formation Analysis
Shoulder head and shoulders formation has been formed; in this formation we expect the price to react downwards as long as the formation length.
IV. Fear & Greed Analysis
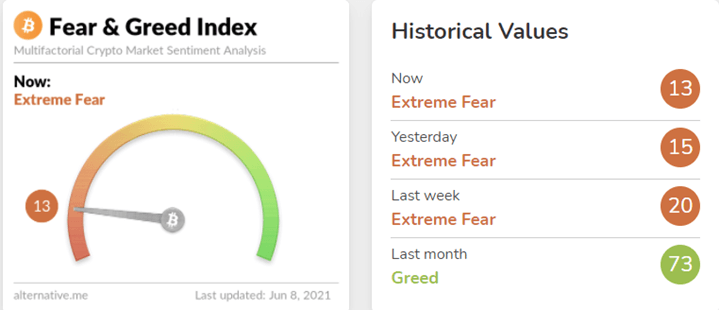
Chart 4-Fear & Greed Index
This index scored 13 out of 100 for BTC, which shows us that there is still a serious fear in the market.
Source: https://alternative.me/crypto/fear-and-greed-index/
V. News Perspective
Here are the headlines of the most recent news for BTC:
- Chinese social media giant Weibo is reportedly banning crypto-related accounts.
- There’s more trouble on the horizon for South Korean cryptocurrency exchanges. The country’s financial regulator plans to prevent cross trading on its platforms.
- Trump: Bitcoin “Seems Like a Scam,” Threatens the Dollar
- Bitcoin Daily Transaction Rate Dips by 35%, Google Trends Data Shows Interest Has Dropped Since May
- Crypto markets tumble after miners unload 5,000 BTC in one week
DISCLAIMER
This article does not constitute and cannot replace investment advice.
CryptoIndexSeries does not recommend that any cryptocurrency should be bought, sold, or held by you. Do conduct your own due diligence and consult your financial advisor before making any investment decisions.
For more data, tools, analytics and news on Crypto Markets, register CryptoIndexSeries on cryptoindexseries.com
References
LATEST CIS GAZETTE ISSUES
