CIS Price Analysis
DOT / US Dollar Analysis (DOT/USD)
18/06/2021 18:00 UTC
|
Price / Performance Summary |
|
|
|
|
|
Price |
$21,690 |
|
High |
$23,430 |
|
Low |
$21,480 |
|
|
|
|
7 Day |
-4,4% |
|
30 Day |
-46,8% |
|
3 Month |
-44,9% |
|
6 Month |
318,7% |
|
9 Month |
307,7% |
|
12 Month |
637,8% |
|
Simple Moving Averages (d) |
||
|
|
Value |
Action |
|
10-d |
22,710 |
HOLD |
|
20-d |
23,159 |
HOLD |
|
30-d |
23,047 |
HOLD |
|
50-d |
29,265 |
WEAK SELL |
|
(6,21)-d |
23,159 - 22,935 |
WEAK BUY |
|
(50,200)-d |
29,209 - 25,232 |
HOLD |
|
Exponential Moving Averages |
|
|
|
10-d |
22,760 |
HOLD |
|
20-d |
23,660 |
HOLD |
|
30-d |
24,952 |
HOLD |
|
50-d |
27,249 |
WEAK SELL |
|
Simple - Exponential Moving Averages Pairing |
||
|
20-d |
23,607 - 23,159 |
SELL |
|
Oscillators (d) |
||
|
|
Value |
Action |
|
RSI (14) |
43,57 |
HOLD |
|
MACD (5,35,5) |
(-3,00 -3,14) |
STRONG SELL |
|
CCI(14) |
-55,44 |
HOLD |
|
Bollinger Bands |
N/A |
WEAK SELL |
|
Chande Momentum Oscillator |
-14,06 |
HOLD |
|
DEMA(20,50) |
21,423 - 22,935 |
WEAK BUY |
|
Stokastik Oscillator (14,3,3) |
(36,58 - 44,55) |
HOLD |
|
Williams %R |
-69,19 |
HOLD |
|
Chaikin Osilatörü |
-0,3M |
WEAK SELL |
|
Detrended Price Osilatörü |
-2,61 |
HOLD |
|
Volume-Demand Oscillators (d) |
|
|
|
Demand Index |
-0,303 |
HOLD |
|
Money Flow Index |
43,7 |
HOLD |
I. Trend Analysis
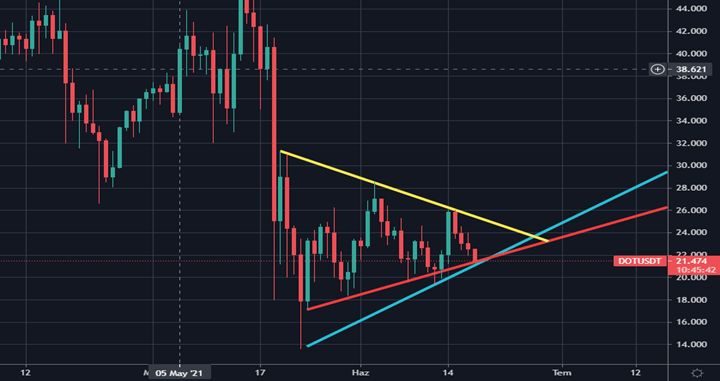
Chart 1 – Trend Analysis
The uptrend, which has been continuing since May 20, 2021 is shown with a red colour, this is our main trend. The secondary trend is indicated by the blue colour and will definitely break down.
II. Support & Resistance Points & Fibonacci Retreament
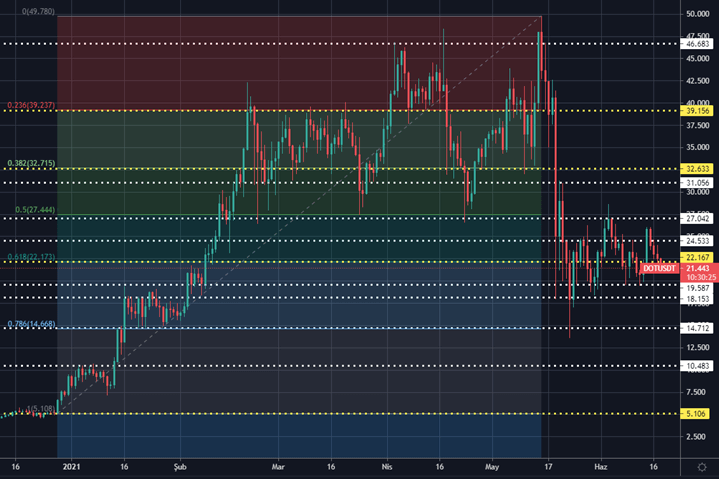
Chart 2- Support & Resistance & Fibonacci Retreament
Below are the main support and resistance points
|
MAIN RESISTENCES |
|
|
MAIN SUPPORTS |
|
|
|
|
|
|
|
|
5.Fib-Main Resistance |
$32,633 |
|
1.Main Support |
$19,587 |
|
4.Main Resistance |
$31,056 |
|
2.Main Support |
$18,153 |
|
3.Main Resistance |
$27,042 |
|
3.Main Support |
$14,712 |
|
2.Main Resistance |
$24,533 |
|
4.Main Support |
$10,483 |
|
1.Fib Resistance |
$22,167 |
|
5.Fib Support |
$5,106 |
III. Formation Analysis
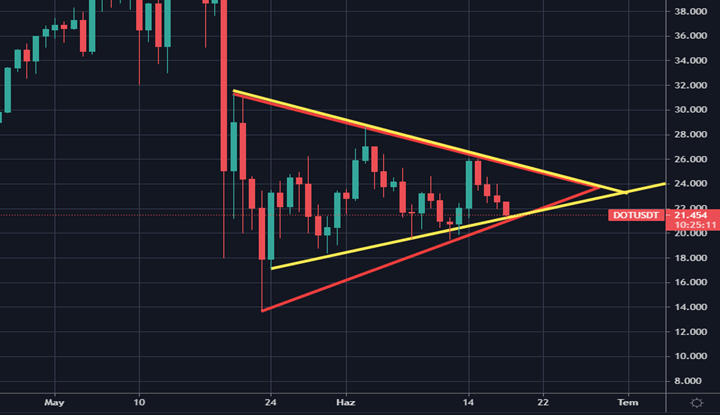
Chart 3-Formation Analysis
Here, there are 2 symmetrical triangle formations connected to 2 trends. Prices have started to squeeze, it is expected to take volume from the broken points.
IV. Fear & Greed Analysis
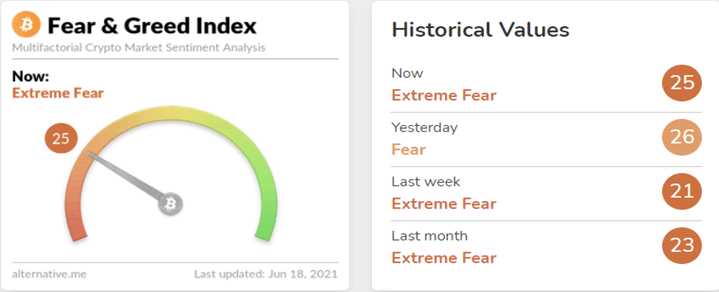
Chart 4-Fear & Greed Analysis
This index scored 25 out of 100 for DOT, which shows us that there is still a serious fear in the market.
Source: https://alternative.me/crypto/fear-and-greed-index/
V. News Perspective
Here are the headlines of the most recent news for DOT:
-Stake Technologies secures $10M to build DApp ecosystem for Polkadot and Kusama.
-Coinbase Listing and Parachain Progress Boost Polkadot 16%.
DISCLAIMER
This article does not constitute and cannot replace investment advice.
CryptoIndexSeries does not recommend that any cryptocurrency should be bought, sold, or held by you. Do conduct your own due diligence and consult your financial advisor before making any investment decisions.
For more data, tools, analytics and news on Crypto Markets, register CryptoIndexSeries on cryptoindexseries.com
CIS Price Analysis

