CIS Price Analysis
GT / US Dollar Analysis (GT/USD)
18/06/2021 18:00 UTC
|
Price / Performance Summary |
|
|
|
|
|
Price |
$3,830 |
|
High |
$4,030 |
|
Low |
$3,800 |
|
|
|
|
7 Day |
-5,1% |
|
30 Day |
-46,5% |
|
3 Month |
82,4% |
|
6 Month |
751,1% |
|
9 Month |
561,5% |
|
12 Month |
653,9% |
|
Simple Moving Averages (d) |
||
|
|
Value |
Action |
|
10-d |
3,990 |
WEAK BUY |
|
20-d |
4,290 |
WEAK BUY |
|
30-d |
4,420 |
HOLD |
|
50-d |
5,540 |
SELL |
|
(6,21)-d |
(3,91 - 4,25) |
WEAK BUY |
|
(50,200)-d |
(5,55 - 2,39) |
HOLD |
|
Exponential Moving Averages |
|
|
|
10-d |
4,030 |
WEAK BUY |
|
20-d |
4,320 |
WEAK BUY |
|
30-d |
4,520 |
HOLD |
|
50-d |
4,640 |
HOLD |
|
Simple - Exponential Moving Averages Pairing |
||
|
15-d |
4,15 - 4,15 |
BUY |
|
Oscillators (d) |
||
|
|
Value |
Action |
|
RSI (14) |
41,33 |
HOLD |
|
MACD (5,35,5) |
(-0,6733 -0,6943) |
WEAK SELL |
|
CCI(14) |
-88,67 |
WEAK BUY |
|
Bollinger Bands |
N/A |
HOLD |
|
Chande Momentum Oscillator |
-26,7 |
HOLD |
|
DEMA(20,50) |
(3,76 - 4,84) |
HOLD |
|
Stokastik Oscillator (14,3,3) |
(13,92 - 16,55) |
BUY |
|
Williams %R |
-84,39 |
BUY |
|
Chaikin Oscillator |
-171,67 |
HOLD |
|
Detrended Price Oscillator |
-0,94 |
WEAK BUY |
|
Volume-Demand Oscillators (d) |
|
|
|
Demand Index |
-0,2581 |
HOLD |
|
Money Flow Index |
42,39 |
HOLD |
I. Trend Analysis
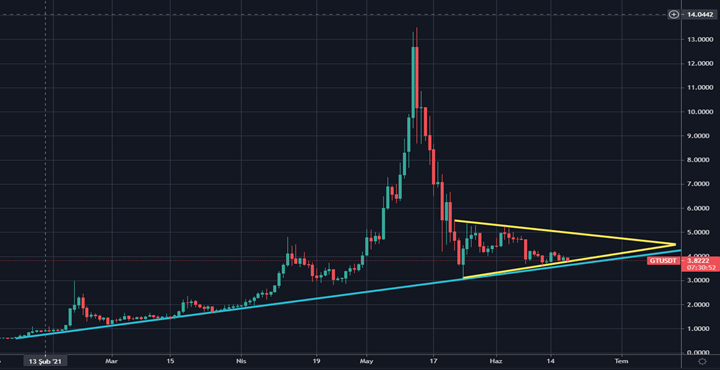
Chart 1 – Trend Analysis
The upward trend, which started at the beginning of February 2021, continues to rise by seeking support at 28 points and continues its movement. Currently, it continues to oscillate within the symmetrical triangle formation.
II. Support & Resistance Points & Fibonacci Retreament
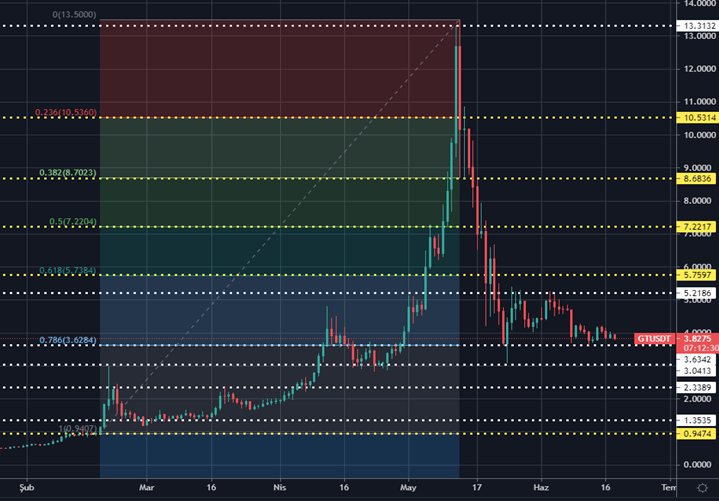
Chart 2- Support & Resistance & Fibonacci Retreament
The 5 main resistance and support levels are as follows:
|
MAIN RESISTANCES |
|
|
MAIN SUPPORTS |
|
|
|
|
|
|
|
|
5.Fib Resistance |
$10,531 |
|
1.Main Support |
$3,634 |
|
4.Fib Resistance |
$8,684 |
|
2.Main Support |
$3,041 |
|
3.Main Resistance |
$7,222 |
|
3.Main Support |
$2,339 |
|
2.Fib Resistance |
$5,760 |
|
4.Main Support |
$1,354 |
|
1.Main Resistance |
$5,219 |
|
5.Fib Support |
$0,947 |
III. Formation Analysis
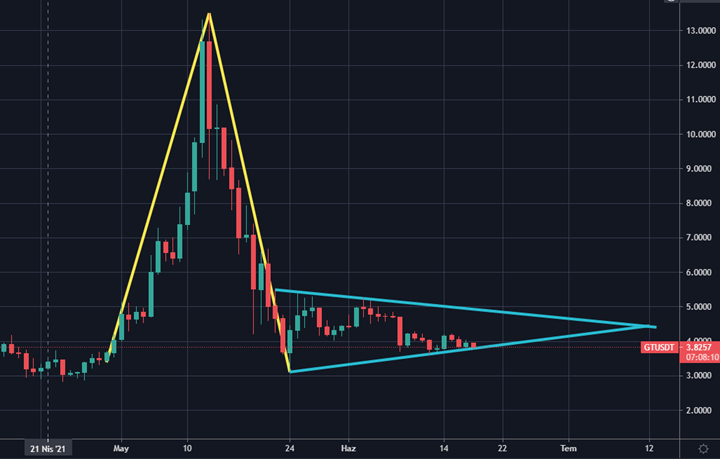
Chart 3-Formation Analysis
In the above figure, an inverted V pattern has formed, which is shown in yellow, in this pattern we expect the price to react downwards as much as the length of the pattern. Second formation formed is the symmetrical triangle formation shown in blue, in this formation we expect the price to gain volume in the direction of the breakout.
IV. Fear & Greed Analysis
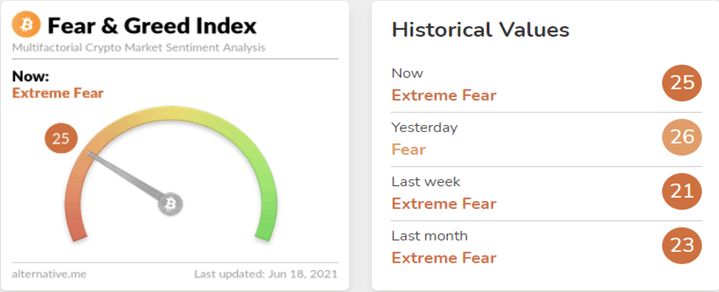
Chart 4-Fear & Greed Analysis
This index scored 25 out of 100 for GT, which shows us that there is still a serious fear in the market.
Source: https://alternative.me/crypto/fear-and-greed-index/
DISCLAIMER
This article does not constitute and cannot replace investment advice.
CryptoIndexSeries does not recommend that any cryptocurrency should be bought, sold, or held by you. Do conduct your own due diligence and consult your financial advisor before making any investment decisions.
For more data, tools, analytics and news on Crypto Markets, register CryptoIndexSeries on cryptoindexseries.com
CIS Price Analysis

