CIS Price Analysis
SOL / US Dollar Analysis (SOL/USD)
03/06/2021 18:00 UTC
|
Price / Performance Summary |
|
|
|
|
|
Price |
$37,147 |
|
High |
$37,230 |
|
Low |
$31,470 |
|
|
|
|
7 Day |
3,1% |
|
30 Day |
-20,2% |
|
3 Month |
197,4% |
|
6 Month |
1776,1% |
|
9 Month |
788,7% |
|
12 Month |
6239,1% |
|
Simple Moving Averages (d) |
||
|
|
Value |
Action |
|
10-d |
31,843 |
BUY |
|
20-d |
35,868 |
HOLD |
|
30-d |
38,552 |
BUY |
|
50-d |
38,552 |
BUY |
|
(6,21)-d |
(31,843-36,156) |
HOLD |
|
(50,200)-d |
(38,647 - 15,934) |
HOLD |
|
Exponential Moving Averages |
|
|
|
10-d |
33,370 |
BUY |
|
20-d |
34,718 |
BUY |
|
30-d |
35,485 |
BUY |
|
50-d |
38,456 |
STRONG BUY |
|
Simple - Exponential Moving Averages Pairing |
||
|
25-d |
(35,581 - 37,402) |
HOLD |
|
Oscillators (d) |
||
|
|
Value |
Action |
|
RSI (14) |
51,22 |
HOLD |
|
MACD (12,26) |
(-1,947 -2,152) |
STRONG BUY |
|
CCI(14) |
1,62 |
HOLD |
|
Bollinger Bands |
N/A |
STRONG BUY |
|
Chande Momentum Oscillator |
25,22 |
HOLD |
|
DEMA(20,50) |
(32,035 - 39,318) |
HOLD |
|
Stokastik Oscillator (14,3,3) |
(62,21-44,97) |
HOLD |
|
Williams %R |
-36,02 |
HOLD |
|
Chaikin Osilatörü |
3,156M |
BUY |
|
Detrended Price Osilatörü |
-5,26 |
HOLD |
|
Volume-Demand Oscillators (d) |
|
|
|
Demand Index |
0,23 |
BUY |
|
Money Flow Index |
45,79 |
HOLD |
I. Trend Analysis

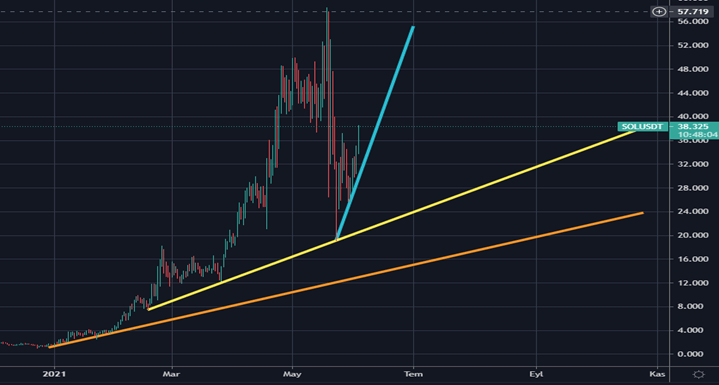
The main direction of the uptrend, which started at the beginning of 2021 and is expressed in orange, continues. The second trend is the uptrend shown by the yellow line. This trend has also received support at 3 points. The third trend is represented by a blue line. It is certain that this trend will break down. Trend analysis shows that the long-term healthy growth is currently supported by these three trends.
II. Support & Resistance Points & Fibonacci Retreament

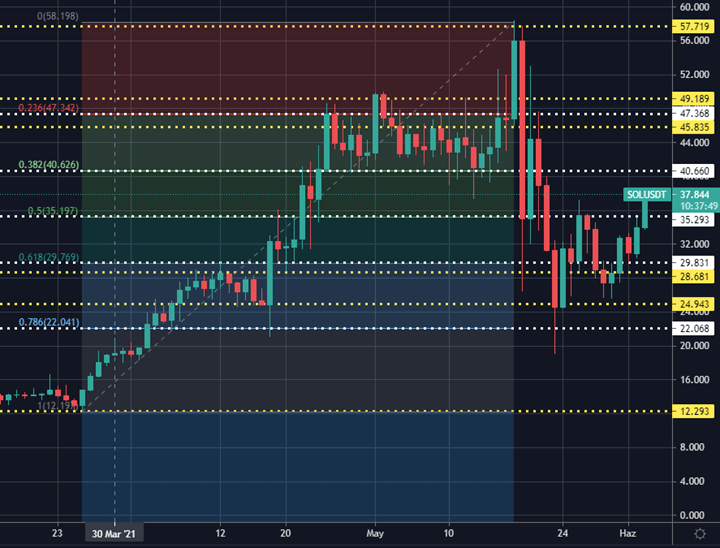
Chart 2- Support & Resistance & Fibonacci Retreament
Let’s talk about 5 main support and 5 main resistance points. Below are the main support and resistance points.
|
MAIN RESISTENCES |
|
|
MAIN SUPPORTS |
|
|
|
|
|
|
|
|
5.Fib Resistence |
$57,719 |
|
1.Fib Support |
$35,293 |
|
4.Fib Resistence |
$49,189 |
|
2.Fib Support |
$29,831 |
|
3.Main Resistence |
$47,368 |
|
3.Main Support |
$28,681 |
|
2.Fib Resistence |
$45,835 |
|
4.Main Support |
$24,943 |
|
1.Main Resistance |
$40,660 |
|
5.Fib Support |
$22,068 |
III. Formation Analysis

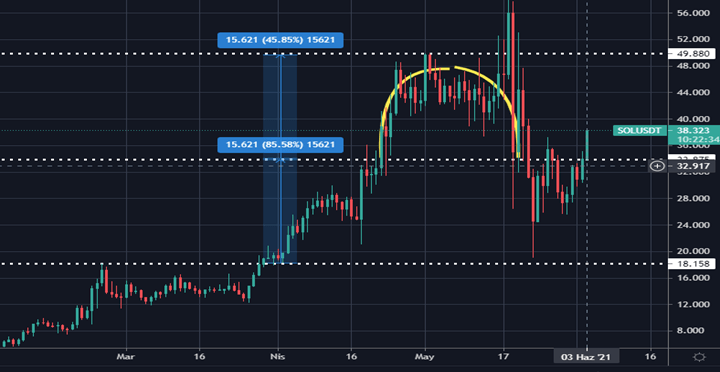
Chart 3-Formation Analysis
Inverted bowl formation has been formed, in this formation we expect the price to react downwards as long as the formation length.
IV. Fear & Greed Analysis

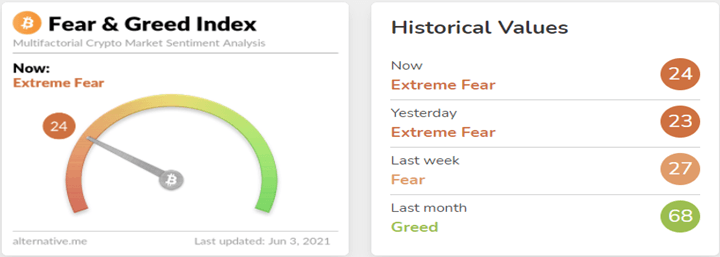
Chart 4-Fear & Greed Analysis
This index scored 24 out of 100 for SOL, which shows us that there is still a serious fear in the market.
Source: https://alternative.me/crypto/fear-and-greed-index/
V. News Perspective
Here are the headlines of the most recent news for SOL:
- NFT Marketplace Metaplex to Launch on Solana,
- Shopify for NFTs' Launches on Solana Blockchain
- Solana is the latest blockchain to stand up an NFT offering. Its MetaPlex marketplace tool offers creatives low-cost and flexibility.
- Solana’s blockchain project will receive an additional boost from a newly-launched $20 million fund coming from the Solana Foundation and ROK Capital.
For more data, tools, analytics and news on Crypto Markets, register CryptoIndexSeries on cryptoindexseries.com
References
LATEST CIS GAZETTE ISSUES
