CIS Price Analysis
Crypto Market Cap/ US Dollar Analysis
24/05/2021 15:00 UTC
|
Price / Performance Summary |
|
|
|
|
|
Price |
1,473B |
|
High |
1,503B |
|
Low |
1,230B |
|
|
|
|
7 Day |
-29,5% |
|
30 Day |
-20,7% |
|
3 Month |
-4,6% |
|
6 Month |
138,7% |
|
9 Month |
301,4% |
|
12 Month |
498,8% |
|
Simple Moving Averages (d) |
||
|
|
Value |
Action |
|
10-d |
1,754B |
WEAK SELL |
|
20-d |
2,033B |
WEAK SELL |
|
30-d |
2,052B |
WEAK SELL |
|
50-d |
2,024B |
SELL |
|
(6,21)-d |
(1,549B - 2,026B) |
SELL |
|
(50,200)-d |
(2,024B-1,303B) |
HOLD |
|
Exponential Moving Averages |
|
|
|
10-d |
1,709B |
WEAK SELL |
|
20-d |
1,879B |
WEAK SELL |
|
30-d |
1,939B |
WEAK SELL |
|
50-d |
1,939B |
SELL |
|
Simple - Exponential Moving Averages Pairing |
||
|
14-d |
(1,795B-1,941B) |
SELL |
|
Oscillators (d) |
||
|
|
Value |
Action |
|
RSI (14) |
34,56 |
HOLD |
|
MACD (12,26) |
(-161,70- -70,22) |
HOLD |
|
CCI(14) |
-122 |
BUY |
|
Bollinger Bands |
N/A |
SELL |
|
Chande Momentum Oscillator |
-50,22 |
STRONG BUY |
|
DEMA(20,50) |
(1,694B-2,022B) |
WEAK SELL |
|
Stokastik Oscillator (14,3,3) |
(20,24-24,48) |
WEAK BUY |
|
Average True Range |
307B |
HOLD |
|
Chaikin Osilatörü |
34,89 |
HOLD |
|
Detrended Price Osilatörü |
-660B |
HOLD |
|
Volume-Demand Oscillators (d) |
|
|
|
Demand Index |
-0,12 |
HOLD |
|
Money Flow Index |
34,28 |
HOLD |
I. Trend Analysis

Chart 1 - Trend Analysis
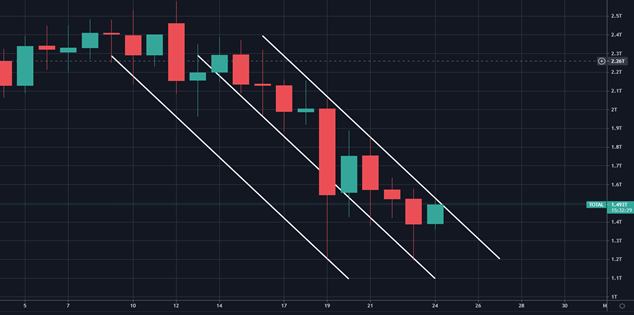
The trend that started on May the 10th, 2021 continued till today though we have seen a slight increase in the performance and the market cap of crypto assets in the last several hours. In order to persuade us that the market is breaking this trend, we need to see that prices cross the high line with volume and remain there. Unless this advancing channel is disrupted, anxiety can be expected to continue to dominate.
II. Support & Resistance & Fibonacci Retreament

Chart 2- Support & Resistance & Fibonacci Retreament
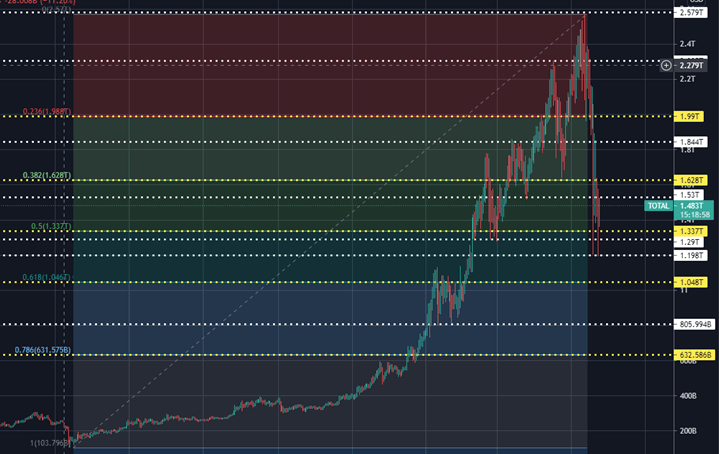
Let’s look at 5 main support and 5 main resistance points. Below are the main support and resistance points. Fibonacci correction was applied according to the uptrend that started in early March 2020. The resistance points in case of an upward break with volume are given below. In case the rest follows, we can expect the following support points to come in order.
|
MAIN RESISTANCE POINTS |
|
|
MAIN SUPPORT POINTS |
|
|
|
|
|
|
|
|
5.Main Resistence |
2,305B |
|
1.Fib Support |
1,337B |
|
4.Fib Resistence |
1,990B |
|
2.Main Support |
1,290B |
|
3.Main Resistence |
1,844B |
|
3.Main Support |
1,198B |
|
2.Fib Resistence |
1,628B |
|
4.Fib Support |
1,048B |
|
1.Main Resistance |
1,530B |
|
5.Main Support |
0,805B |
III. Formation Analysis

Chart 3-Formation Analysis
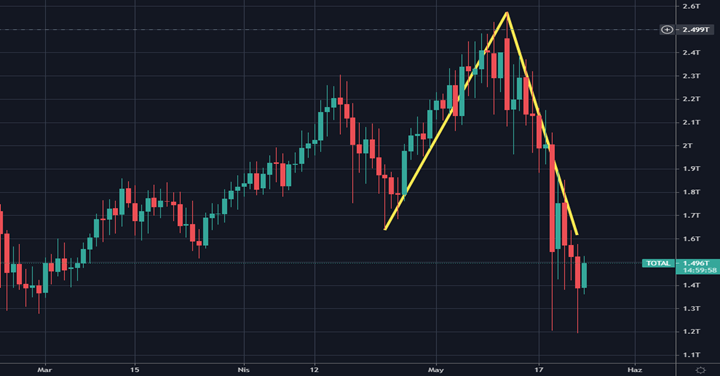
An inverted V pattern has formed, where prices rise very quickly, leaving a single candlestick line at the top and falling to the exit points at the same speed. They make both the rise and the fall voluminous.
IV. Fear & Greed Analysis
Feer and Greed Analysis Index gives an indicator around the sentiment analysis felt by the traders in the market.
Chart 4-Fear & Greed Index
The index currently shows 10 out of 100, can be described as the extreme fear in the market due to sharp fall.
Source: https://alternative.me/crypto/fear-and-greed-index/
V. News Perspective
Here are the latest news with high news sentiment scores based on CryptoIndexSeries scoring:
-Last week Musk warned that Tesla still plans to use BTC as a payment method, but for now, it is suspended. The company wants the cryptocurrency to use cleaner energy in its mining and thus preserve the environment. The Tesla project with Bitcoins is suspended for now, but it will have altcoins available as a payment method. (1)
-Stocks, China and the dollar: 3 reasons why Bitcoin price is tanking below $40K. Elsewhere in the macro picture, tech stocks are suffering — and that’s also something that tends not to bode well for Bitcoin. Following a curious report by Reuters about China allegedly banning further aspects of cryptocurrency commerce, stocks began to come under pressure.(2)
-Many pin the events of yesterday on FUD (Fear, Uncertainty, Doubt), whether Elon FUD, China FUD, or OCC FUD. However, an “insider” on anonymous board 4Chan claims it was a coordinated attack by an unnamed firm connected to the Chinese government. Such claims, without a verifiable source, should be taken with a healthy dose of skepticism. But the post was made 12 hours before markets dumped and did predict the sell-off.(3)
To have a wholistic view of Crypto Markets and in-depth analytics, check out CryptoIndexSeries.com.
For more data, tools, analytics and news on Crypto Markets, register CryptoIndexSeries on cryptoindexseries.com
References
LATEST CIS GAZETTE ISSUES

