CIS Price Analysis
MarketCap Excluding BTC Analysis
13/05/2021 13:00 UTC
|
Price / Performance Summary |
|
|
Price |
1,243B |
|
High |
1.485B |
|
Low |
1.121B |
|
|
|
|
7 Day |
-2,0% |
|
30 Day |
30,2% |
|
3 Month |
116,6% |
|
6 Month |
691,7% |
|
9 Month |
745,6% |
|
12 Month |
1560,4% |
|
Simple Moving Averages (d) |
||
|
|
Value |
Action |
|
10-d |
1,265B |
HOLD |
|
20-d |
1,145B |
HOLD |
|
30-d |
1,082B |
HOLD |
|
50-d |
0,958B |
HOLD |
|
(6,21)-d |
(1,282B-1,122B) |
HOLD |
|
Exponential Moving Averages |
||
|
|
|
Action |
|
10-d |
1,242B |
HOLD |
|
20-d |
1,168B |
HOLD |
|
30-d |
1,102B |
HOLD |
|
50-d |
0,992B |
HOLD |
|
Simple - Exponential Moving Averages Pairing |
||
|
14-d |
(1,218B-1,212B) |
SELL |
|
Oscillators (d) |
||
|
|
Value |
Action |
|
RSI (14) |
60,63 |
SELL |
|
MACD (12,26) |
(98,34-98,34) |
STRONG SELL |
|
CCI(14) |
56,63 |
WEAK SELL |
|
Bollinger Bands |
N/A |
HOLD |
|
Chande Momentum Oscillator |
22,95 |
HOLD |
|
DEMA(20,50) |
(1,298T-1,219T) |
HOLD |
|
Stokastik Oscillator (14,3,3) |
(61,76-68,31) |
WEAK SELL |
|
Average True Range |
168B |
HOLD |
|
Chaikin Osilatörü |
106,93 |
HOLD |
|
Detrended Price Osilatörü |
2,61836E+11 |
HOLD |
|
Volume-Demand Oscillators (d) |
|
|
|
Demand Index |
0,08 |
STRONG SELL |
|
Money Flow Index |
58,26 |
SELL |
I. Trend Analysis

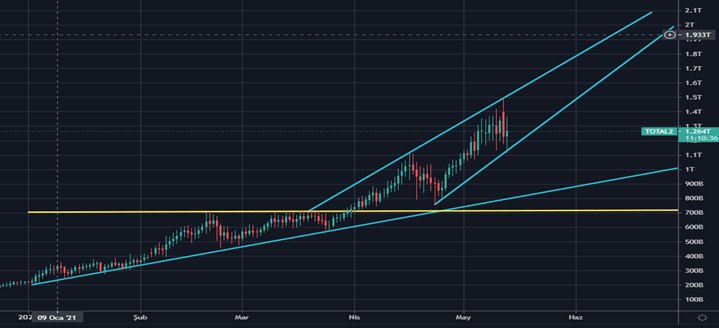
Chart 1 - Trend Analysis
Altcoins, which have had an upward trens since January 2021, continue their way with an incredible rise. It is possible to talk about 2 trends in the first stage: the main trend and the secondary trend. The Main Trend has been tested approximately 16 times since the beginning of January 2021 and sees a very strong level of support. The secondary trend is the sharp upward trend that started in April 23, 2021 and continues until today. The secondary trend has been tested 3 times and it may not continue in the long term as it involves a very strong slope. But the Main trend is a longer-lasting upward trend that promotes healthier growth.
II. Support & Resistance Points & Trend Retreament

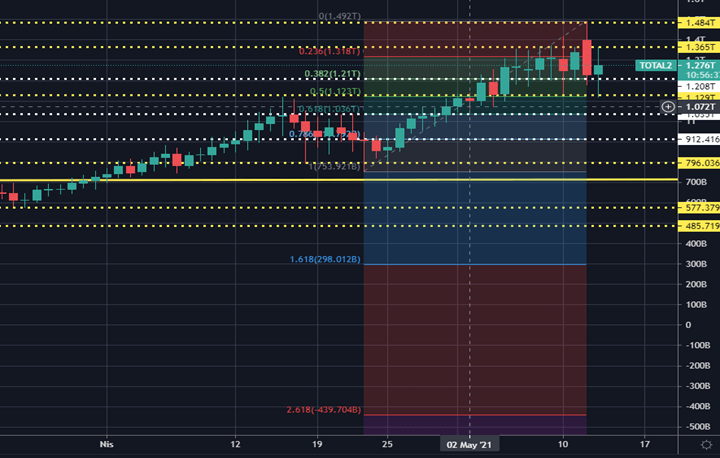
Chart 2-Support & Resistance Points & Fibonacci Retreament
We can talk about 2 main resistance points and 5 main support points. Since the peak has just been tried here, it would not be healthy to look at trend-based Fibonacci application as it might give incorrect results for the next resistances. Current resistance and support points are listed below.
|
MAIN RESISTENCES |
|
|
MAIN SUPPORTS |
|
|
|
|
|
|
|
|
1.Main Resistence |
1,365B |
|
1.Fib Support |
1,208B |
|
2.Main Resistence |
1,484B |
|
2.Main Support |
1,129B |
|
3.Main Resistence |
N/A |
|
3.Fib Support |
1,035B |
|
4.Main Resistence |
N/A |
|
4.Fib Support |
0,912B |
|
5.Main Resistance |
N/A |
|
5.Fibonacci Support |
0,796B |
III. Formation Analysis

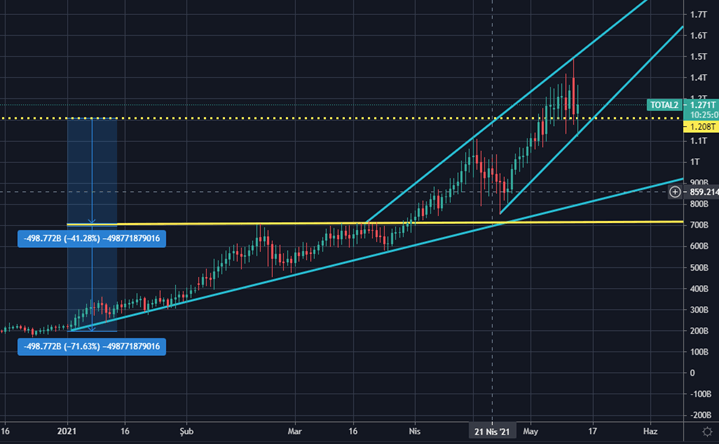
Chart 3-Formation Analysis
Here, ascending triangle and ascending wedge formations have been formed. The rising triangle formation started at the beginning of January 2021 and continued until March 31, 2021. When this formation is over, it indicates that there will be a target of increasing as long as the height of the formation. This corresponds to a total volume of 1.208 trillion dollars. This formation has reached its result. Next is the wedge formation, which is a continuously rising formation with a narrowing structure and in the medium term it usually breaks downwards. We can say that the wedge formation started in April the 1st, 2021, will probably break down in the medium term and introduce a serious correction.
IV. News Perspective
-Bitcoin Price Falls as Tesla Halts Vehicle Purchase in BTC. Elon Musk, CEO of Tesla, tweeted his concerns regarding the environment and how Bitcoin mining is harmful. He announced that Tesla would not be selling Bitcoin until the mining transforms into more sustainable energy. The tweet shook the market, and almost $365.85 billion was wiped off.
-Stan Druckenmiller: US Will Likely Lose Reserve Currency Status in 15 Years, Hard to Unseat Bitcoin as Store of Value. Legendary fund manager Stanley Druckenmiller says that he is worried that within 15 years the U.S. dollar will lose its world’s reserve currency status. He said that crypto is a solution to the lack of trust in Fed Chairman Jerome Powell “and the rest of the world’s central bankers.” The billionaire investor further said that it will be very difficult to unseat bitcoin as a store of value.
-Since late February, Bitcoin nosedived by more than $12,000 in a day and plummeted to its lowest price level. According to Bybit, the liquidations in the past 24 hours alone are worth almost $4 billion. Somewhat expectedly, over 90% of them came from long positions. Despite recovering some ground and currently sitting above $51,000, bitcoin’s market cap dived well below the coveted $1 trillion lines. Furthermore, BTC’s market dominance also keeps sliding and is down to 41%. Following bitcoin’s fall, other altcoins also witnessed significant losses. Ethereum, the top gainer among the larger-cap altcoins, had just painted yet another all-time high of nearly $4,400.
-The ruling class is turning its eye to the cryptocurency space. Institutional adoption is one of the biggest stories of the last few months. After that, governments might follow suit. From MicroStrategy to Square, from Visa to Goldman Sachs, institutional buyers and big companies are slowly moving into the space. The money attracted them, and their presence created a feedback loop that fueled prices.
For more data, tools, analytics and news on Crypto Markets, register CryptoIndexSeries on cryptoindexseries.com
LATEST CIS GAZETTE ISSUES
