CIS Price Analysis - 30/05/2021
SXP / USD Analysis
|
Price / Performance Summary |
|
|
|
|
|
Price |
$2,08 |
|
High |
$2,12 |
|
Low |
$1,76 |
|
|
|
|
7 Day |
3,6% |
|
30 Day |
-54,8% |
|
3 Month |
-55,1% |
|
6 Month |
121,1% |
|
9 Month |
-32,1% |
|
12 Month |
332,9% |
|
Simple Moving Averages (d) |
||
|
|
Value |
Action |
|
10-d |
2,100 |
BUY |
|
20-d |
2,865 |
HOLD |
|
30-d |
3,560 |
WEAK SELL |
|
50-d |
3,807 |
WEAK SELL |
|
(6,21)-d |
(2,134 - 2,929) |
HOLD |
|
(50,200)-d |
(3,79-2,33) |
HOLD |
|
Exponential Moving Averages |
|
|
|
10-d |
2,263 |
WEAK BUY |
|
20-d |
2,755 |
HOLD |
|
30-d |
3,065 |
HOLD |
|
50-d |
3,345 |
HOLD |
|
Simple - Exponential Moving Averages Pairing |
||
|
14-d |
(2,35-2,12) |
WEAK BUY |
|
Oscillators (d) |
||
|
|
Value |
Action |
|
RSI (14) |
38,56 |
WEAK BUY |
|
MACD (12,26) |
(-0,587 &-0,541) |
BUY |
|
CCI(14) |
-61,4 |
HOLD |
|
Bollinger Bands |
N/A |
HOLD |
|
Chande Momentum Oscillator |
-8,66 |
HOLD |
|
DEMA(20,50) |
(1,99-3,05) |
WEAK SELL |
|
Stokastik Oscillator (14,3,3) |
(23,22-26,90) |
WEAK BUY |
|
Average True Range |
-74 |
WEAK BUY |
|
Chaikin Osilatörü |
12,947M |
HOLD |
|
Detrended Price Osilatörü |
-0,304 |
WEAK BUY |
|
Volume-Demand Oscillators (d) |
|
|
|
Demand Index |
0 |
WEAK BUY |
|
Money Flow Index |
28 |
WEAK BUY |
I. Trend Analysis
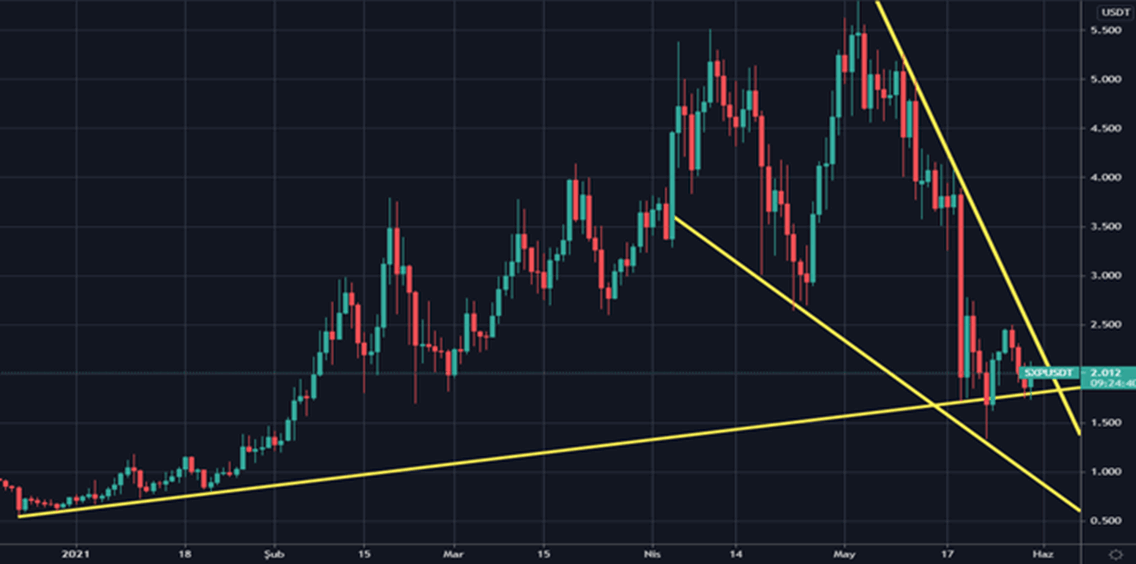
Chart 1 - Trend Analysis
The upward trend, which has been continuing since December 23, 2020, continues to exist as the main trend. But recently, this trend has worked 6 times as a support level. In addition to this trend, there is a downward trend that continues as of May 3, 2021 and progresses downward with a serious slope. The price is stuck between these two trends and it can be expected to break through in the direction it will go.
II. Support & Resistance & Fibonacci Retreament
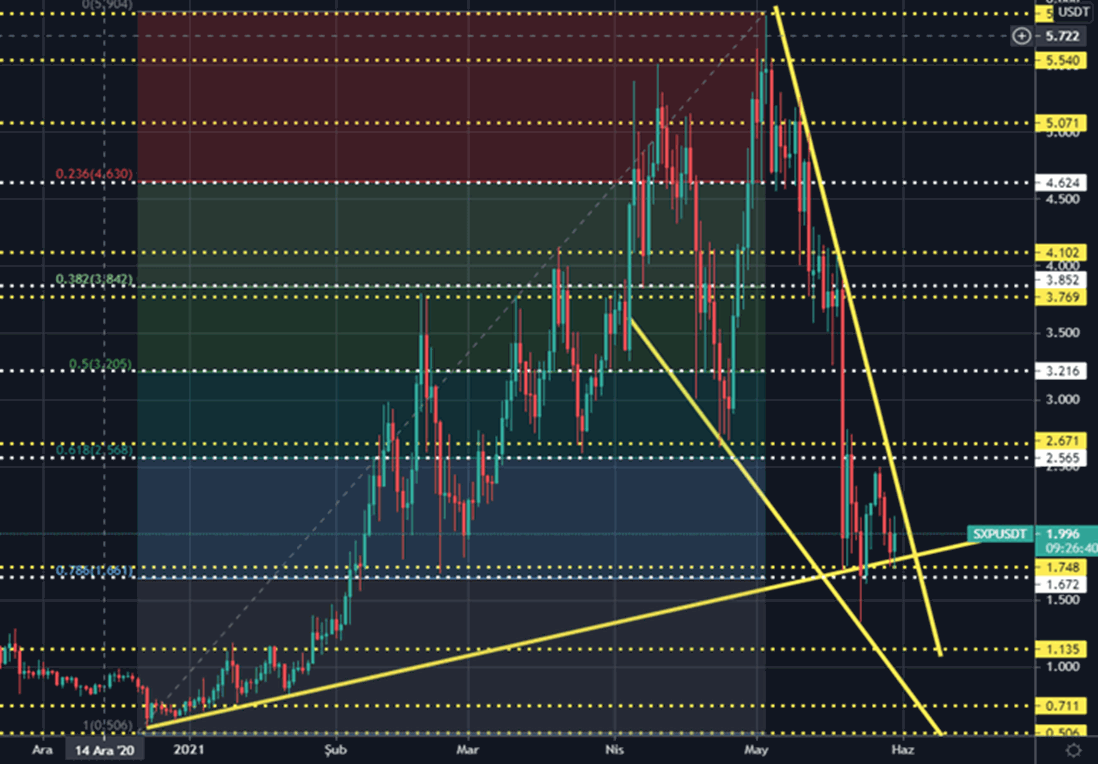
Chart 2- Support & Resistance & Fibonacci Retreament
We can talk about 5 main support and 5 main resistance points. Below are the main support and resistance points. If the uptrend is broken, a voluminous drop and subsequent testing of support points can be expected. But if the downtrend, which is the 2nd Trend, is broken, a voluminous rise can be expected. It should be followed carefully.
|
MAIN RESISTANCE POINTS |
|
|
MAIN SUPPORT POINTS |
|
|
|
|
|
|
|
|
5.Main Resistence |
$3,852 |
|
1.Fib Support |
$1,748 |
|
4.Fib Resistence |
$3,769 |
|
2.Main Support |
$1,672 |
|
3.Main Resistence |
$3,216 |
|
3.Main Support |
$1,135 |
|
2.Fib Resistence |
$2,671 |
|
4.Fib Support |
$0,711 |
|
1.Main Resistance |
$2,565 |
|
5.Main Support |
$0,506 |
III. Formation Analysis
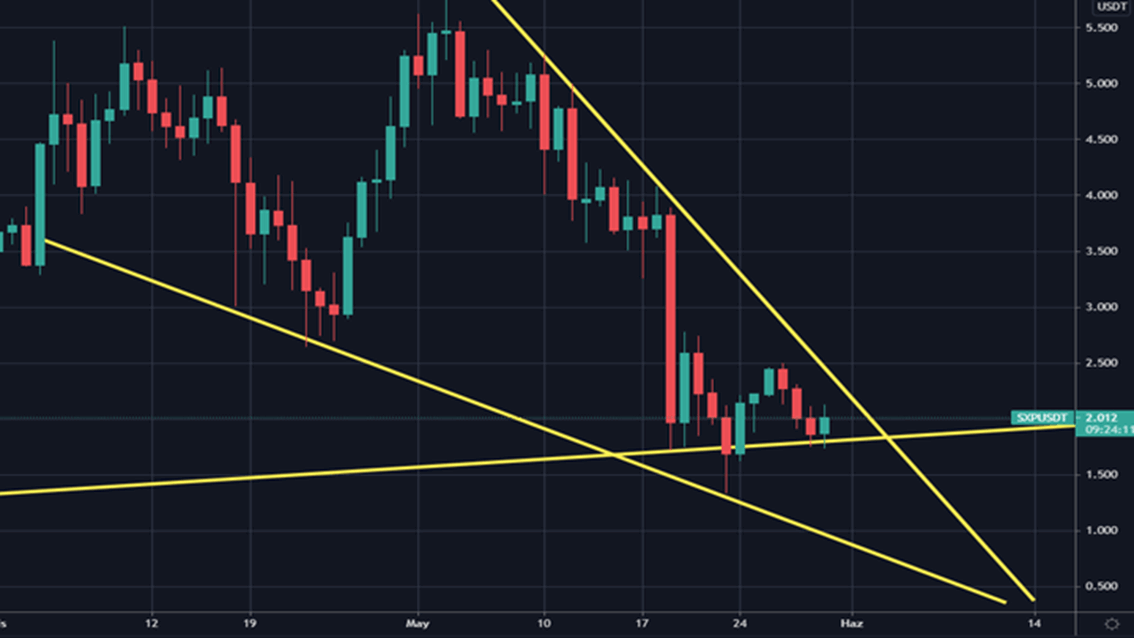
Chart 3-Formation Analysis
Inverted Wedge formation has been formed, these formations are broken in volume upwards.
IV. Fear & Greed Analysis
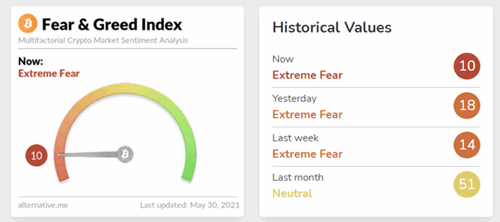
Chart 4-Fear & Greed Index
The Fear & Greed Index scores 10 out of 100 for this pair which shows that there is still extreme fear in the market.
Source: https://alternative.me/crypto/fear-and-greed-index/
V. News Perspective
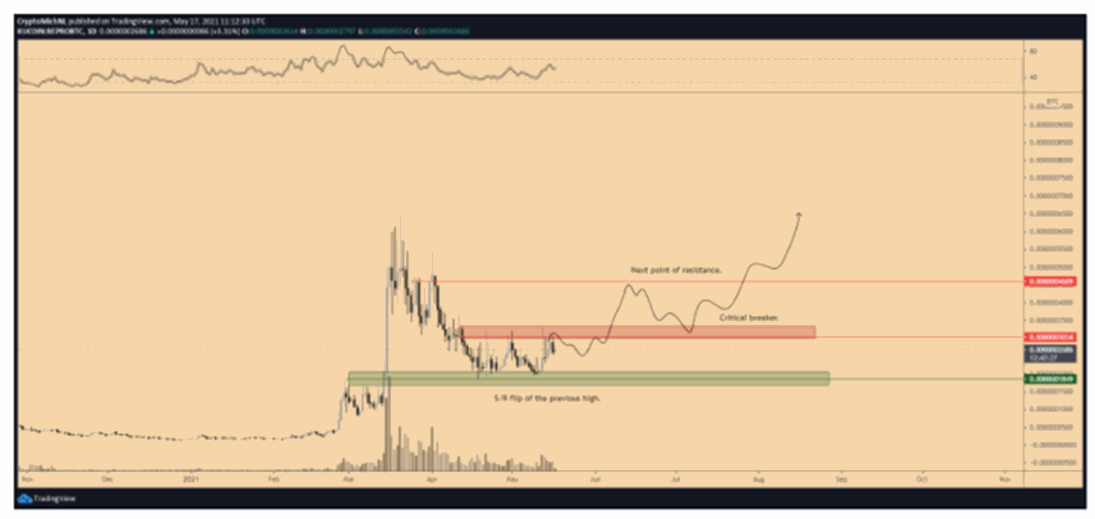
- Seven Low-Cap Altcoins Jostling for Huge Breakouts, According to Trader Michaël van de Poppe; one of them is SXP. The last coin is crypto-fiat gateway Swipe in its Bitcoin pair (SXP/BTC). Van de Poppe believes that the accumulation phase of SXP/BTC is nearing its conclusion and it is now poised to rally to 0.00035 from 0.000085, representing potential gains of over 385%.
LATEST CIS GAZETTE ISSUES

CIS Price Analysis
SXP / US Dollar Analysis
30/05/2021 15:00 UTC
References
